
Opening your brokerage app during a rough week in the market feels like a punch to the stomach. Even when you know the textbook rules of long-term investing, watching your hard-earned balance drop in real time triggers an immediate, physical reaction.
We like to believe we are rational investors, but volatility changes how we experience time. A single red week can feel like a year when you are living inside the uncertainty of it. Yet, when we look back at past market crashes from the safety of the present, those exact same moments barely register as a speed bump.
Why does a market drop feel like the end of the world in the moment, yet look like a harmless blip a decade later? The answer comes down to two things: the lens you are looking through, and what you actually own inside your portfolio.
The Visual Wake-Up Call: One Event, Two Lenses
To see how dramatically our perception shifts, let us rewind the clock to early 2020. The world was suddenly confronting a global pandemic, lockdowns were rolling across borders, and the global economy slammed on the brakes.
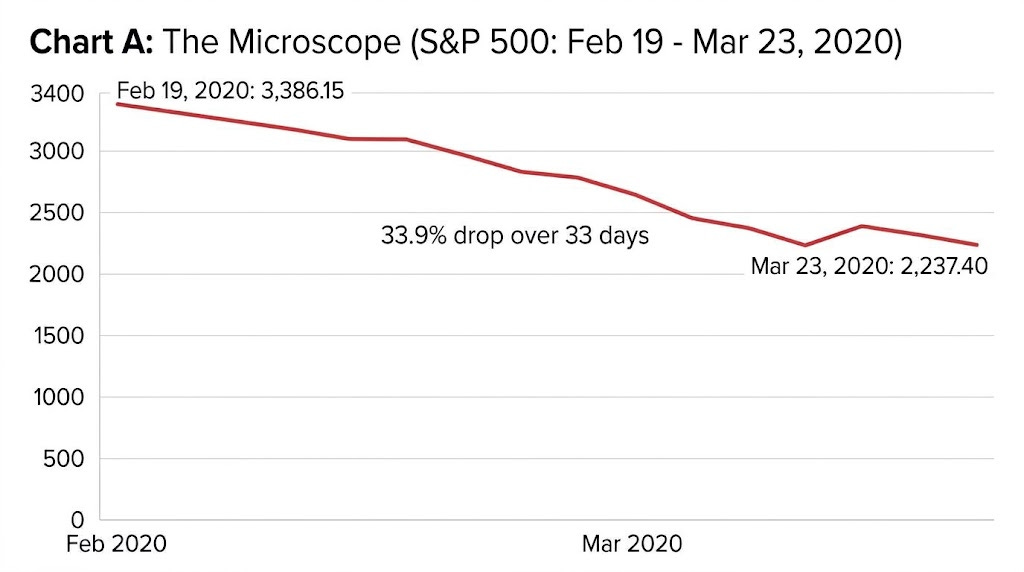
First, let us look at that moment through the Microscope (Chart A above). On February 19, 2020, the S&P 500 closed at a record high of 3,386.15. Over the next 33 calendar days, the index plunged 33.9%, bottoming out at 2,237.40 on March 23, 2020. Market-wide circuit breakers halted trading four separate times in two weeks. On March 16 alone, the index fell 12.0% in a single day.
Looking at that 33-day chart in isolation is terrifying. It does not look like a normal market cycle; it looks like a free-falling elevator. If that 1-month window was the only picture on your screen, selling everything to protect what you had left felt like the only sane choice.
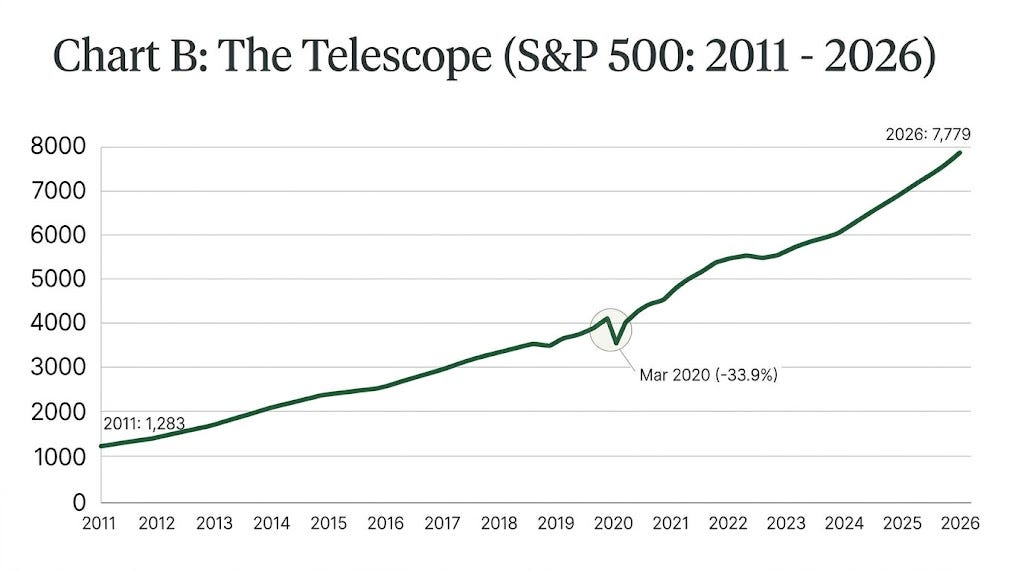
Now, let us put down the Microscope and look at the exact same event through the Telescope (Chart B above). Zoom out to a 15-year window spanning from the start of 2011, when the S&P 500 sat near 1,283, to late October 2026, with the index standing above 7,770.
Where did the terrifying elevator drop go? Circled in the middle of that 15-year climb, the historic 33.9% collapse of March 2020 looks like a minor pothole on a mountain highway. In fact, by August 18, 2020, less than five months after hitting bottom, the S&P 500 had already climbed back above its February record close and finished the full year of 2020 up 18.4%.
Here is the wild truth: the underlying data did not change between Chart A and Chart B. The exact same dollars were lost and recovered in those 33 days. The only thing that changed was the camera lens. Your financial news feed and your brokerage app default to the Microscope because daily drama captures your attention, but lasting wealth is only visible through the Telescope.
The Hindsight Illusion: Why Today Always Feels Worse
If the Telescope makes past crashes look so small, why does volatility today still make us anxious? You might look at the 2008 financial crisis or the 2020 COVID crash on a long-term chart and think: That was such an obvious buying opportunity. Why did anyone panic?
We think past crashes were easy because we are viewing them as history, not memory. When you look at a chart of March 2020 today, your brain already knows the happy ending. You know vaccines were developed, supply chains adapted, corporate earnings rebounded, and the market more than tripled from that March low over the following six years.
Living through volatility in the present strips away the script. On March 23, 2020, nobody knew that day was the bottom. Investors were reading projections of a multi-year depression, worrying about their jobs, and wiping down grocery bags in their kitchens.
A 5% or 10% dip today feels worse than a 34% historical crash because today’s dip is attached to tomorrow’s uncertainty. Validating that feeling is crucial. You are not bad at money if a volatile week makes you uncomfortable; your brain is simply reacting to a story whose ending has not been written yet.
Why You Can Trust the Telescope: The Basket and the Human Engine
At this point, a skeptical voice might ask a fair question: how do we know the next big dip will not be permanent? After all, there are plenty of charts that drop like a rock and never come back.
If you are investing in individual stocks, the Telescope will not always save you. I learned that the hard way early in my investing journey when I chased a single stock I was sure would skyrocket, only to watch it plummet and never recover. Single companies are fragile. During a severe downturn, an individual business can run out of cash, get disrupted by new technology, or collapse under debt. When a single stock hits a wall, zooming out to a 15-year chart just shows a flatline at zero.
This is why owning the whole basket through a broad market index fund or ETF changes the math entirely. A broad index is a self-cleansing ecosystem. When a crisis hits and weak companies shrink or fail, they naturally lose weight and eventually exit the basket. Meanwhile, the businesses that adapt, innovate, and solve the new problems of the era grow to take their place. You do not have to guess who will survive the storm when you own the whole haystack.
More importantly, look at what sits underneath those ticker symbols. We often talk about “the market” as if it is an abstract casino algorithm spinning in a vacuum. In reality, an index fund is a collection of millions of real human beings waking up every morning trying to solve problems, feed their families, improve technology, cure diseases, and serve customers.
When the world shut down in March 2020, humanity did not sit on its hands and accept defeat. Millions of engineers, scientists, logistics workers, and business owners pivoted overnight. They reconfigured global supply chains, built remote collaboration tools in weeks, and found entirely new ways to create economic value.
Betting on the basket is not a bet on a static list of 500 corporations. It is a bet on human ingenuity and our collective refusal to stand still. Individual companies can die, and headlines will always find a new reason to panic, but human problem-solving has an undefeated long-term track record.
3 Ways to Put Down the Microscope
Knowing that the Telescope wins over decades is helpful, but surviving the Microscope on a Tuesday afternoon requires a system. You can insulate your portfolio from short-term emotional reflexes with three practical steps:
Fund Your Buffer So You Never Have to Sell: The only person who gets hurt on a rollercoaster is the one who jumps off in the middle of the ride. By keeping six months of living expenses safe inside the short-term bucket of your bucket system, you guarantee that a market drop will never force you to liquidate your long-term investments to pay next month’s bills.
Put Your Buying on Autopilot: When the Microscope looks scary, willpower will try to talk you out of investing. When you pay yourself first through automated paycheck or monthly transfers into a broad index fund, your system automatically buys more shares while the market is on sale, no bravery required.
Change Your Default View: If checking your portfolio on red days triggers money anxiety, delete the brokerage app from your phone’s home screen. And the next time you log in on your computer, click the “Max” or “10Y” button on the chart before you look at your balance. Force your eyes to look through the Telescope first.
Market volatility is the admission fee we pay for long-term compounding. You cannot control what the headlines or the tickers do over the next 33 days. What you can control is which lens you hold up to your eyes, and whether you own a self-healing basket powered by human resilience. Put down the Microscope, trust the Telescope, and let time do the heavy lifting.
Let’s Talk Money!
Think back to March 2020 (or another major market drop): What did that moment feel like for you in real time, and how does looking at it on a 15-year chart today change how you view the next downturn?
When you log into your financial accounts, do you find yourself looking through the Microscope (daily or weekly numbers) or the Telescope (multi-year progress toward your goals)?
How does viewing an index fund as millions of people waking up every day to solve problems shift your emotional reaction when the market has a red week?